District Information
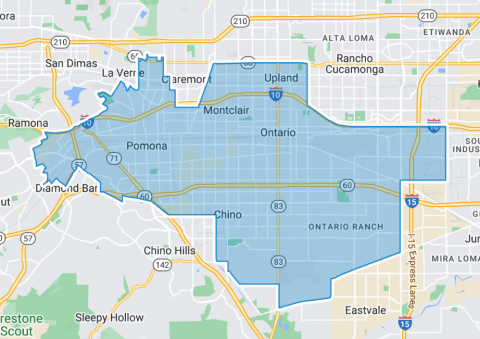
DISTRICT AD53
2020 Census Population (adj Elec. §21003)
| Name | Count | Percent |
|---|
| Total Population (POP) | 475,714 | 100.00% |
|---|
| POP Hispanic or Latino | 314,721 | 66.16% |
|---|
| POP Not Hispanic or Latino (NH) | 160,993 | 33.84% |
|---|
| POP NH Population of one race | 151,071 | 31.76% |
|---|
| POP NH White alone | 67,821 | 14.26% |
|---|
| POP NH Black or African American alone | 24,903 | 5.23% |
|---|
| POP NH Asian alone | 54,006 | 11.35% |
|---|
| POP NH American Indian and Alaska Native alone | 1,094 | 0.23% |
|---|
| POP NH Native Hawaiian and Other Pacific Islander alone | 795 | 0.17% |
|---|
| POP NH Some Other Race alone | 2,452 | 0.52% |
|---|
| POP NH Population of two or more races | 9,922 | 2.09% |
|---|
2020 Census Housing Occupancy Status
| Name | Count | Percent |
|---|
| Total Housing Units | 141,654 | 100.00% |
|---|
| Occupied | 137,543 | 97.10% |
|---|
| Vacant | 4,111 | 2.90% |
|---|
2020 Census Group Quarters Population (adj Elec. §21003)
| Name | Count | Percent |
|---|
| Total Group Quarters Population: | 8,651 | 100.00% |
|---|
| Institutionalized population: | 2,644 | 30.56% |
|---|
| Correctional facilities for adults | 0 | 0.00% |
|---|
| Juvenile facilities | 131 | 1.51% |
|---|
| Nursing facilities/Skilled-nursing facilities | 2,499 | 28.89% |
|---|
| Other institutional facilities | 14 | 0.16% |
|---|
| Noninstitutionalized population: | 6,007 | 69.44% |
|---|
| College/University student housing | 3,512 | 40.60% |
|---|
| Military quarters | 0 | 0.00% |
|---|
| Other noninstitutional facilities | 2,495 | 28.84% |
|---|
Counties In District
| Name | Count | Percent |
|---|
| Los Angeles | 155,465 | 1.55% |
|---|
| San Bernardino | 320,247 | 14.69% |
|---|
Places In District
| Name | Count | Percent |
|---|
| LOS ANGELES: Pomona(C) | 152,554 | 100.00% |
|---|
| LOS ANGELES: Remainder of Los Angeles(R) | 2,911 | 3.32% |
|---|
| SAN BERNARDINO: Chino(C) | 78,202 | 90.33% |
|---|
| SAN BERNARDINO: Montclair(C) | 37,989 | 100.00% |
|---|
| SAN BERNARDINO: Ontario(C) | 152,471 | 86.71% |
|---|
| SAN BERNARDINO: Upland(C) | 38,970 | 49.10% |
|---|
| SAN BERNARDINO: Remainder of San Bernardino(R) | 12,615 | 10.40% |
|---|
